Quick Start
In this quickstart, we give an end-to-end demo of how to use the Rockfish SDK to generate a synthetic dataset that can be shared across data silos. You will learn how to:
This quickstart guide can be run in a notebook or as a Python script (Python >=3.9).
tl;dr: Skip the explanations with a full working notebook or Python script.
Connect to the Rockfish Platform
Get an API Key
To get started with Rockfish Platform, you will need an API key. If you don’t have one, please contact support@rockfish.ai
Set Up the Rockfish Platform
For this quickstart, we will set up Rockfish using the SDK. To deploy Rockfish in your own environment follow our installation guide.
First, create the virtual environment and activate it:
$ python -m venv rf-venv
$ source rf-venv/bin/activate
Next, install the latest available version of rockfish-sdk:
$ (rf-venv) python -m pip install --upgrade pip  # make sure you have the latest version of pip
$ (rf-venv) pip install -U 'rockfish[labs]' -f 'https://packages.rockfish.ai'  # install the rockfish-sdk package
Asyncio
The Rockfish SDK uses asyncio and should be used from within an asyncio Task. If you are working in a Jupyter notebook this is handled automatically using Jupyter's "autoawait" feature; this style is used in examples.
If writing a standalone script you should arrange for asyncio to run your main function as a Task:
async def main():
    ...

asyncio.run(main())
In your script or notebook, start by importing the necessary libraries:
import rockfish as rf
import rockfish.actions as ra
import rockfish.labs as rl
Next, connect to the Rockfish platform:
ROCKFISH_API_KEY = # "MY-API-KEY"
conn = rf.Connection.remote(ROCKFISH_API_KEY)
(Optional) Rockfish Integration
Follow this tutorial to understand how to integrate the Rockfish platform into your pipeline.
Load a dataset
For this demo, we will work with a tabular dataset related to fall incidents. Each record consists of a fall incident, and features include properties of the person (e.g., body temperature, age, whether they were in physical therapy, whether they used medication, etc). You may need to install wget:
(rf-venv) pip install wget
import wget
filename = wget.download(https://docs.rockfish.ai/tutorials/fall_detection.csv)
We will convert the dataset to a Rockfish data object
dataset = rf.Dataset.from_csv("fall_detection", filename)
Automatically parse the column fields as categorical or not. The Rockfish SDK offers more advanced options for onboarding datasets, which conducts other types of data filtering and config generation.
categorical_fields = (
    dataset.to_pandas().select_dtypes(include=["object"]).columns
)

# Create a data configuration
data_config = {
    "metadata": [
        {"field": field, "type": "categorical"}
        for field in categorical_fields
    ]
    + [
        {"field": field, "type": "continuous"}
        for field in dataset.table.column_names
        if field not in categorical_fields
    ],
}
Finally, let's set up a workflow and add our dataset to it.
builder = rf.WorkflowBuilder()
builder.add_dataset(dataset)
Train a synthetic data model
First, we will select a model type and a number of training epochs. For this demo we will manually select a tabular GAN model. However, these selections can be automated using the recommendation engine.
tab_gan_train_config = {
    "encoder": data_config,
    "tabular-gan": {
        "epochs": 100,
    }
}
train = ra.TrainTabGAN(tab_gan_train_config)
builder.add_action(train, parents=[dataset])
We are now ready to train our model!
workflow = await builder.start(conn)
print(f"Workflow: {workflow.id()}")
model = await workflow.models().nth(0)
Generate data
To generate data, we will create a generation configuration and action based on our model, and add it to our workflow. Then we will start the workflow.
tab_gan_generate_config = {
    "tabular-gan": {
        "records": 2582
    }
}

# Create the generation and saving actions
generate = ra.GenerateTabGAN(tab_gan_generate_config)
save = ra.DatasetSave({"name": "synthetic"})

# Build a workflow
builder = rf.WorkflowBuilder()
builder.add_model(model)
builder.add_action(generate, parents=[model])
builder.add_action(save, parents=[generate])

# Start the workflow
workflow = await builder.start(conn)
print(f"Workflow: {workflow.id()}")

# Print logs (optional)
async for log in workflow.logs():
    print(log)

# Collect the synthetic data
syn = None
async for sds in workflow.datasets():
    syn = await sds.to_local(conn)
syn.to_pandas()
Evaluate data quality
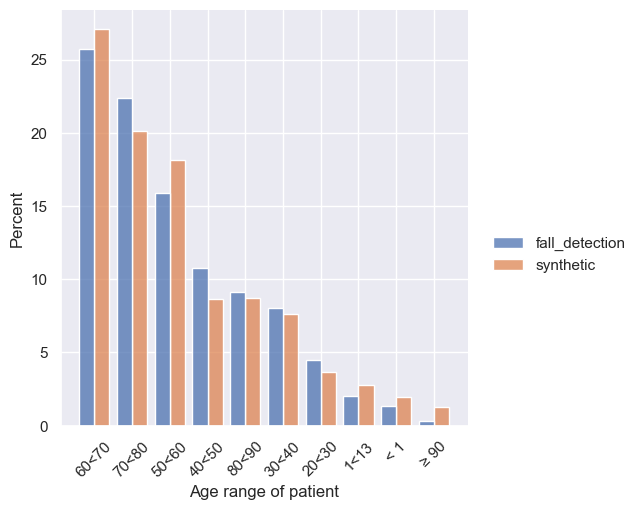
Finally, we are ready to evaluate the quality of our synthetic data. The most basic data evaluation involves comparing histograms for the real and synthetic data. We show how to do more complex evaluations under data evaluations.
First, we will compare the histograms of patient age and sex. First we compute histograms using the Rockfish metrics library (rf.metrics). Then we visualize them using the Rockfish visualization library (rl.vis).
for col in ["Age range of patient", "Sex"]:
    source_agg = rf.metrics.count_all(dataset, col, nlargest=10)
    syn_agg = rf.metrics.count_all(syn, col, nlargest=10)
    rl.vis.plot_bar([source_agg, syn_agg], col, f"{col}_count")
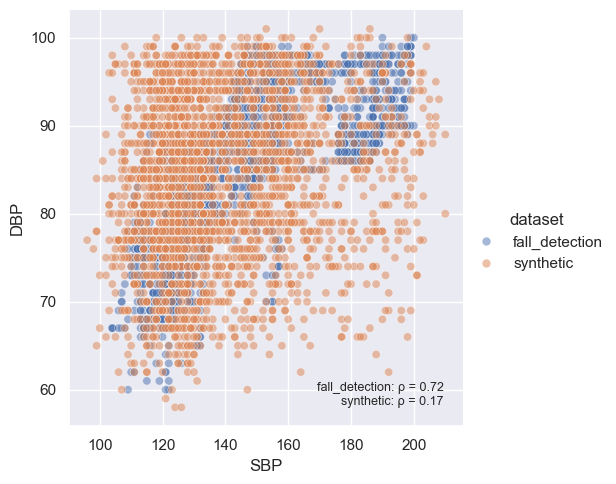
Next, we can evaluate correlations between fields.
col1 = "SBP"
col2 = "DBP"
rl.vis.plot_correlation([dataset, syn], col1, col2, alpha=0.5)
SQL Queries
Rockfish also supports evaluating synthetic data by running SQL queries of your choosing over the real and synthetic data.
# define custom SQL metric
sql_query = 'SELECT `Age range of patient`, AVG(`Body Temperature`) AS `Mean Body Temperature` FROM my_table GROUP BY `Age range of patient`'
dataset_agg = dataset.sync_sql(sql_query)
syn_agg = syn.sync_sql(sql_query)

# visualize the custom SQL metric
rl.vis.plot_bar([dataset_agg, syn_agg], field="Age range of patient", weights="Mean Body Temperature", stat="count");
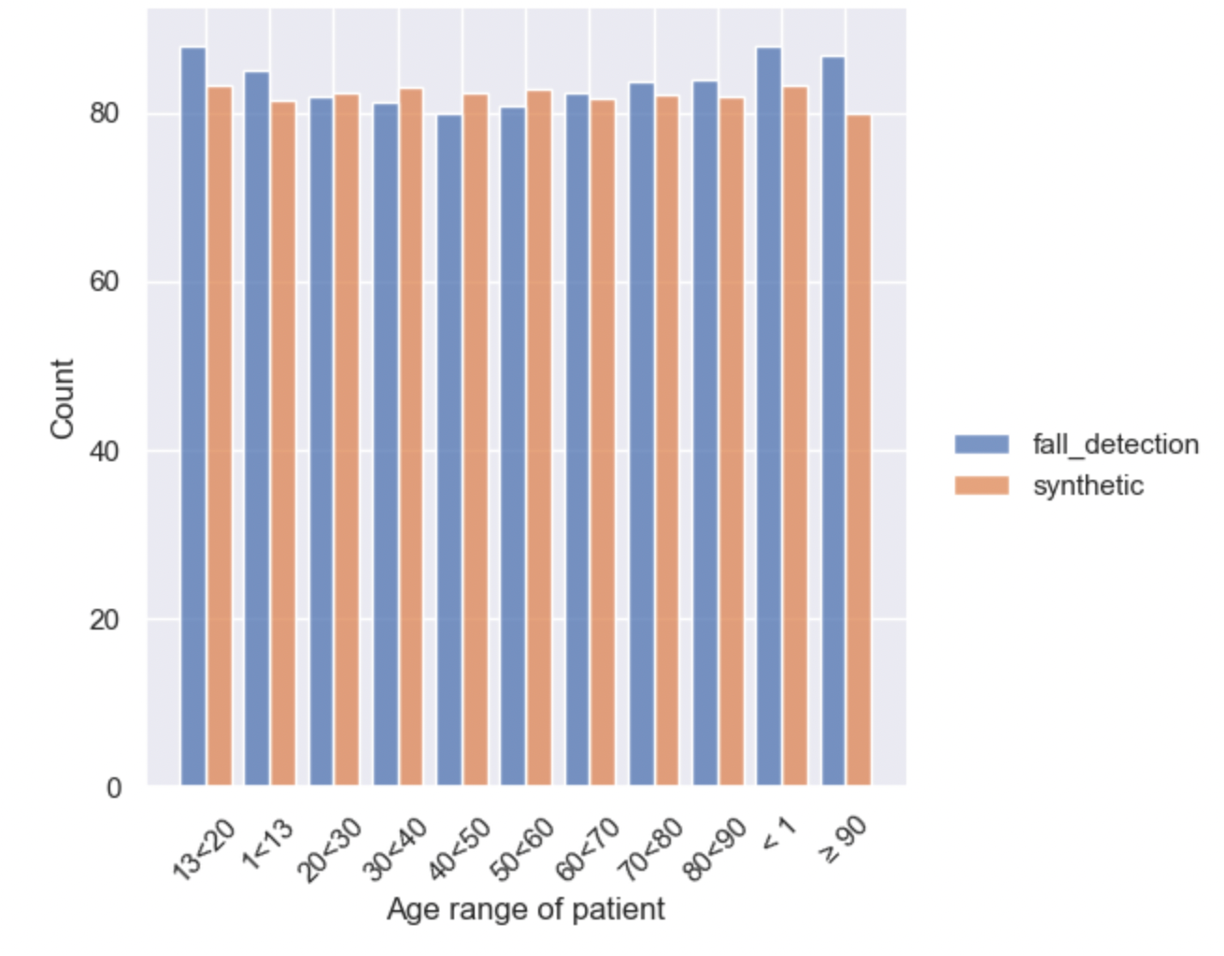
That's it! We can see that the synthetic data exhibits similar patterns to the real data, without directly replicating it.
What's Next
Explore Use Case Tutorials to learn how Rockfish can solve your specific business challenges.
Need Assistance?
For any questions or support, please reach out to us at support@rockfish.ai.